Sooner or later every Oracle Fusion consultant is asked for a report the standard screens do not give. In Fusion, the usual answer is a BI Publisher report: you write the SQL, BI Publisher runs it and formats the result as a PDF, an Excel file or another output. Oracle now also calls the tool Oracle Analytics Publisher, but most people and most job descriptions still say BI Publisher, or just BIP.
This guide walks through building one from nothing, in the order you actually do it on an instance.
OTBI or BI Publisher?
Fusion has two reporting tools, and interviewers like to ask the difference.
- OTBI (Oracle Transactional Business Intelligence) builds analyses by dragging columns from subject areas. You do not write SQL, and the subject areas already know how the tables join. It suits quick, ad hoc questions.
- BI Publisher starts from a data model you define, usually with your own SQL, and lays the result out in a fixed format. It suits documents with an exact layout, extracts for another system, and reports you schedule and deliver.
If the question is "show me this data, sliced a few ways", try OTBI first. If it is "produce this document, in this format, on this schedule", that is BI Publisher.
Before you start
You need a login with BI authoring access to the catalog, and some idea of the tables behind the data you want. Oracle publishes the tables and views for each Fusion module in its "Tables and Views" guides, which are the reference to keep open while you write SQL.
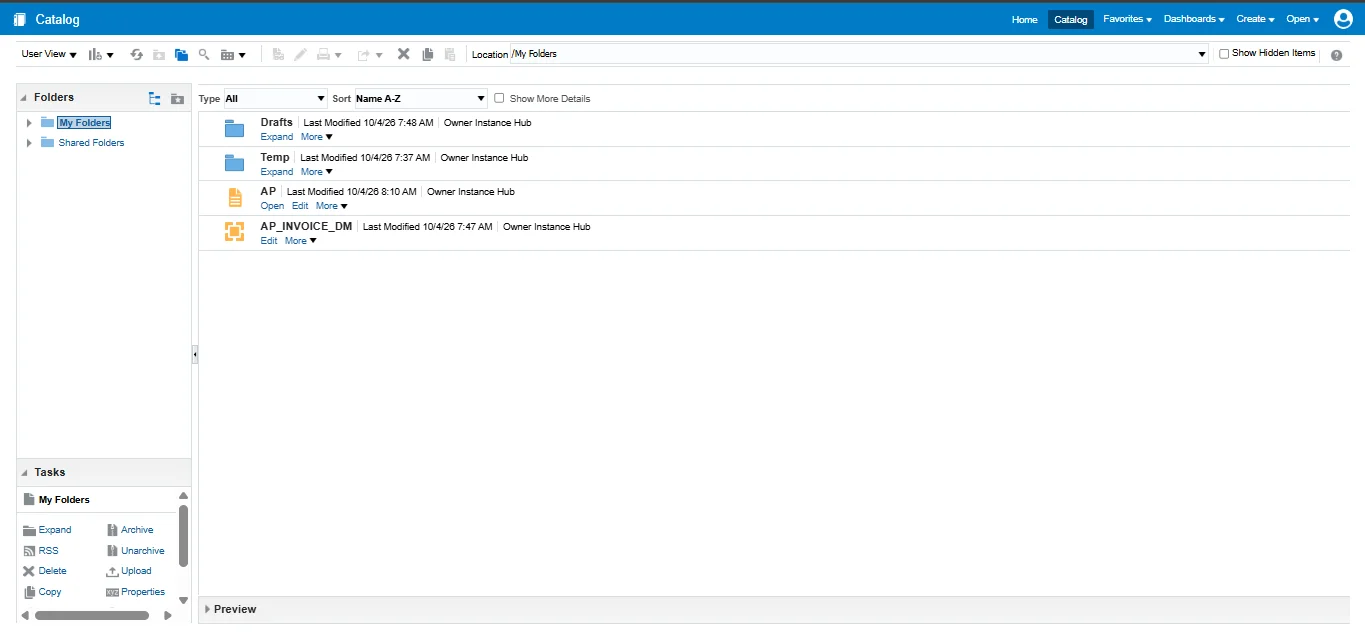
To open the catalog, go to Navigator > Tools > Reports and Analytics, then click Browse Catalog. The catalog has two top-level areas that matter here: My Folders, which only you can see, and Shared Folders, where Oracle's own reports live. Custom content that others should use is usually kept under Shared Folders > Custom. While practising, My Folders is the simplest place to save.
Step 1: Create the data model
The data model is the query half of the report. From the catalog, click New and choose Data Model.
- In the data model editor, open Data Sets, click the plus icon and choose SQL Query.
- Give the data set a name and pick the data source. This choice matters more than anything else on the screen. For Financials and Supply Chain tables choose ApplicationDB_FSCM, for HCM tables ApplicationDB_HCM, and for Sales and CX tables ApplicationDB_CRM. A correct query against the wrong data source fails, because the tables are not where it is looking.
- Type your SQL. A small Payables example to start with:
SELECT invoice_num,
       invoice_date,
       invoice_amount,
       invoice_currency_code
FROM   ap_invoices_all
WHERE  invoice_date >= :P_FROM_DATE
ORDER  BY invoice_date DESC
- Click OK. BI Publisher reads the columns from the query and notices the bind variable
:P_FROM_DATE. It offers to create a parameter for it; accept.
Start with a narrow query like this one and widen it once it works. Joining five tables at once and then hunting for the one join that went wrong is a slow way to learn.
Step 2: Set up the parameter
Open Parameters in the data model. You will find P_FROM_DATE there. Set its Data Type to Date so that the user gets a date picker rather than a text box, and give it a sensible label such as "Invoices from".
Two things to check when a parameter misbehaves:
- The name in the SQL and the name of the parameter must match.
:P_FROM_DATEin the query andP_FROMin the parameter list are two different things. - If a parameter is left empty, the condition that uses it is compared with nothing and usually returns no rows. Either make the parameter mandatory or write the condition to cope with an empty value.
Step 3: Save sample data
This is the step people skip and then wonder why the layout editor has no fields.
- Go to the Data tab of the data model.
- Enter a value for the parameter and click View. You should see your rows as XML or as a table.
- Click Save As Sample Data.
- Save the data model itself, for example in My Folders.
The layout tools use the sample data to know what fields exist and what they look like. Without it, there is nothing to drag onto the page.
Step 4: Create the report and its layout
From the catalog, click New and choose Report. When it asks for a data model, select the one you just saved.
You then choose how to build the layout:
- The layout editor in the browser. Pick a template, drag a table onto the page and drop your fields into it. This is the fastest way to a first working report and is fine for most practice work.
- An RTF template made in Microsoft Word. With Oracle's BI Publisher Template Builder add-in for Word, you can load the sample data, insert fields and design the page in Word, then upload the template to the report. This is how many production reports are built, because Word gives fine control over the printed page.
- An Excel template, when the output has to be a specific spreadsheet.
Save the report next to its data model.
Step 5: Run it
Open the report from the catalog, enter the parameter, and choose the output format from the list, such as PDF, Excel or HTML. If the data model's View gave rows but the report shows nothing, the problem is in the layout, not in the SQL, which narrows the search considerably.
From the catalog you can also Schedule a report, so it runs on its own at a set time and sends the output where you choose. Scheduling is worth trying once, because "how would you send this report every morning" is a common follow-up question.
What to practise next
Once the basic report works, these are the skills that separate a beginner from someone who can be trusted with a reporting requirement:
- Add a second data set and link the two, for example invoice headers and their lines, so the output is grouped rather than flat.
- Add a list of values to a parameter, so the user picks a business unit or a supplier rather than typing one.
- Add a total and a group-level subtotal in the layout.
- Rebuild the same report as an RTF template in Word and compare the effort.
- Recreate a simple version of the same question in OTBI and notice which parts were easier.
All of this needs an instance where you can create things in the catalog and come back to them. If you want that environment, our Fusion plans list what each one includes.
Questions people ask
What is the difference between a data model and a report in BI Publisher?
The data model is the query: the SQL, its parameters and the data it returns. The report is the presentation: the layout and the output formats. One data model can serve several reports.
Which data source should I choose for Fusion Financials tables?
ApplicationDB_FSCM, which covers Financials and Supply Chain. HCM tables use ApplicationDB_HCM and Sales tables use ApplicationDB_CRM.
Why does the layout editor show no fields?
Usually because the data model has no sample data. Run the data model from its Data tab, click Save As Sample Data, save the data model, and open the layout again.
Do I need to know SQL for BI Publisher?
For SQL data sets, yes, at least joins, filters and bind variables. If you want to report without writing SQL, OTBI is the tool to start with.