OTBI, Oracle Transactional Business Intelligence, is the reporting tool most Oracle Fusion users meet first. You build an analysis by choosing columns from a subject area, Fusion works out the joins, and the result reads live data from the application. You do not write SQL.
That makes OTBI the quickest way to answer "show me this data, sliced a few ways", and it is why functional consultants are expected to be comfortable with it. This guide builds one analysis from nothing, in the order you do it on an instance.
OTBI or BI Publisher?
Fusion has two reporting tools, and interviewers often ask the difference.
- OTBI starts from a subject area: a ready-made view of one business area, with the joins already defined. You drag columns, add filters and look at the result as a table, a pivot table or a graph. It suits ad hoc questions and on-screen analysis.
- BI Publisher starts from a data model you define, usually with your own SQL, and lays the result out in a fixed format such as a PDF or an Excel file. It suits documents, extracts and scheduled reports.
If the question can be answered from one subject area, try OTBI first. Our guide to creating a BI Publisher report covers the other tool.
Before you start
You need a login whose roles let you create analyses in the BI catalog. OTBI also applies the same data security as the application, so an analysis only returns the rows your user is allowed to see. If an analysis comes back empty on data you know exists, check what your user can see in the application before you blame the analysis.
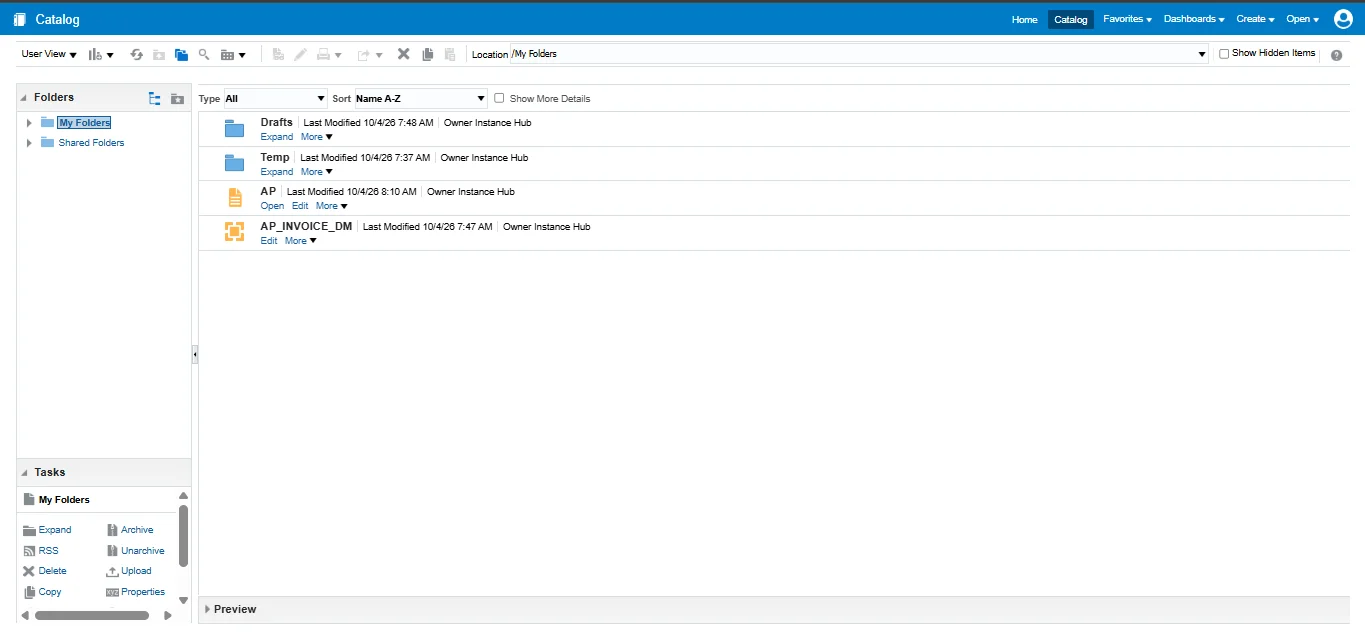
To open the catalog, go to Navigator > Tools > Reports and Analytics, then click Browse Catalog. My Folders is private to you; Shared Folders holds Oracle's content and anything shared with others. While practising, save in My Folders.
Step 1: Pick a subject area
In the catalog, click New and choose Analysis. Fusion asks you to select a subject area.
Subject area names tell you a lot. They name the business area, then what the area is about, and most end in Real Time, which means they query the live transactional data. Two examples:
- Payables Invoices - Transactions Real Time, for supplier invoices.
- Workforce Management - Worker Assignment Real Time, for workers and their assignments.
Choose the subject area that matches the question. An analysis normally uses one subject area, and picking the right one is half the work. If you are not sure which one holds a field, open a likely one and look through its folders, which show what it covers.
Step 2: Choose the columns
The analysis opens on the Criteria tab. On the left is the subject area as a tree of folders:
- Dimension folders hold descriptive attributes: names, numbers, dates, statuses.
- Fact folders hold the measures: amounts and counts that add up.
Double-click a column, or drag it, to add it to Selected Columns. For a first analysis on Payables invoices, pick a supplier name, an invoice number, an invoice date and an invoice amount. Folder and column names differ between subject areas, so expand the folders and read them rather than looking for an exact name.
Keep the first version small. Four or five columns that return sensible rows is a better start than fifteen that return something you cannot check.
Each selected column has a menu where you can sort, rename the heading, change the number or date format, or edit the column formula. The formula editor is where you build calculated columns, for example a CASE expression that groups values into bands.
Step 3: Add filters
Without filters, an analysis returns everything your user can see, which on a real instance can be a lot.
- In Selected Columns, open the menu on the invoice date column and choose Filter.
- Pick an operator such as is greater than or equal to, enter a date, and click OK.
- Add a second filter if you need one, for example on the supplier or the business unit.
The filters appear in the Filters pane. When there are several, they are joined with AND by default, and you can switch a pair to OR or group them from the same pane.
Step 4: Look at the results
Click the Results tab. OTBI runs the analysis and shows a compound layout with a title and a table.
From here you can add more views of the same data:
- A Pivot Table, to put one column across the top, for example amounts by supplier and month.
- A Graph, such as a bar chart of amount by supplier.
Each new view appears in the compound layout under the table. If the results look wrong, go back to Criteria and remove columns until they look right, then add them back one at a time. A column from a folder that does not relate to the others is the usual cause of missing or repeated rows.
The Advanced tab shows the logical SQL that OTBI generated. You do not need to edit it, but reading it is a good way to understand what the analysis is actually asking for.
Step 5: Add a prompt
A hard-coded date filter is fine for practice, but a useful analysis lets the user choose. That is what prompts are for.
- Go back to Criteria and change the date filter's operator to is prompted.
- Open the Prompts tab, add a column prompt on the invoice date, and choose how the user enters it, for example a date picker.
When the analysis runs, the user fills in the prompt first, and the result is filtered by their choice. Prompts can also live on a dashboard and drive several analyses at once, which is the next step after this one.
Step 6: Save, run and export
Click Save Analysis, choose My Folders, and give it a clear name. To run it later, find it in the catalog and click Open.
From the results you can export to Excel, PDF or CSV. Exporting to Excel and checking a few rows against the application screens is a good habit: it is how you prove an analysis is right before anyone relies on it.
What to practise next
Once the first analysis works, these build the skills that come up in real projects and interviews:
- Rebuild the same question as a pivot table with a total and subtotals.
- Add a calculated column, for example the number of days between the invoice date and today.
- Build a dashboard with two analyses and one shared prompt.
- Answer the same question in a different subject area and compare the two.
- Take an analysis you built and recreate it as a BI Publisher report, then note which parts each tool made easier.
All of this needs an instance where you can create content in the catalog, with real transactional data to analyse. If you want that environment, our Fusion plans list what each one includes.
Questions people ask
What is a subject area in OTBI?
A ready-made view of one business area, such as Payables invoices or worker assignments. It defines which columns are available and how the underlying tables join, so you can build an analysis without writing SQL.
Why does my OTBI analysis return no rows?
Check the filters first, then your user's data access: OTBI applies the same data security as the application, so it only returns rows your user can see. If both look right, remove columns until rows appear, then add them back one at a time.
Do I need SQL for OTBI?
No. You build analyses by choosing columns and filters. SQL helps with calculated columns and with reading the logical SQL on the Advanced tab, but it is not required to get started.
Where should I save my practice analyses?
In My Folders, which only you can see. Shared Folders is for content other users should run.